Queensbury Embarks on Comprehensive Traffic Sign Inventory with Mid-West GIS

Mid-West GIS has been selected by the Town of Queensbury to undertake a comprehensive traffic sign inventory project, marking a significant step towards enhancing traffic safety and efficiency within the community. The initiative, scheduled for completion in March 2024, will involve meticulous data collection and analysis of all traffic signage across the town’s 189-mile network of maintained roads.

This comprehensive inventory will provide Queensbury with invaluable data on the condition, location, and type of every traffic sign within the town. This information will be instrumental in streamlining our infrastructure management, optimizing traffic flow, and ensuring the safety of our residents and visitors.”

Queensbury Embarks on Comprehensive Traffic Sign Inventory with Mid-West GIS

The project will encompass the following key components:

  • GPS-enabled data collection: Every traffic sign on town-maintained roads will be precisely geo-located using advanced GPS technology.
  • Detailed attribute recording: Beyond location, over 20 specific attributes of each sign and its post will be recorded, including size, type, material, condition, and visibility.
  • Digital mapping and analysis: The collected data will be integrated into a comprehensive digital map, enabling visual representation and spatial analysis of the town’s entire traffic signage system.

The benefits of this project are multifaceted:

  • Enhanced traffic safety: Accurate and up-to-date data on traffic signage will allow for the swift identification and rectification of outdated, damaged, or missing signs, leading to safer roads for all users.
  • Improved traffic flow: By analyzing the distribution and type of signage across the town, the project will inform strategic decisions regarding traffic control measures and infrastructure upgrades, leading to smoother traffic flow and reduced congestion.
  • Cost optimization: Efficient management of traffic signage resources through accurate inventory data will optimize maintenance and replacement schedules, leading to cost savings for the town.

“Mid-West GIS is committed to providing our clients with the highest quality data and analysis solutions,” stated Shane McDermott. “We are confident that this comprehensive traffic sign inventory will empower the Town of Queensbury to make informed decisions that enhance the safety and efficiency of its transportation network for years to come.”

The Queensbury traffic sign inventory project represents a significant investment in the town’s infrastructure and demonstrates its commitment to providing a safe and efficient transportation system for its residents and visitors. With Mid-West GIS‘s expertise in geospatial data collection and analysis, the town is well-positioned to reap the long-term benefits of this data-driven initiative.

Mid-West GIS has completed Phase I of the Hancock County 911 Address Verification

Working in conjunction with Western Illinois University, this project entails the verification of 911 addresses for every structure in Hancock County, Illinois. Phase I was for all rural roads and Phase II is for the incorporated areas.

911 Address Verification Project

Mid-West GIS is performing all field verifications. This means that each road is driven and the addressable structure is visited in person by the GIS/GPS Specialist. The structure is identified, the street name is verified and finally checked for a 911 address post, mailbox number, or house number. Structures that are not addressed, such as barns, garages, and other outbuildings, are noted as well.

Phase I of this project took approximately 60 days, and Phase II is expected to take the same. It is expected to be completed in the Fall of 2020.

For more information on GIS and GPS related services provided by Mid-West GIS please visit our Services page at https://www.mid-westgis.com/services/

How Did Mid-West GIS Start With Traffic Sign Inventories?

Mid-West GIS was first asked to create a traffic sign inventory back in 2007 by Mason County, Illinois. The County was in dire need of updated traffic signs, and there was a grant from the Illinois Department of Transportation to assist in the cost of the replacement of those signs. In order to qualify for the grant Mason County had to have an up to date and accurate inventory of all signs on their right of ways. GIS was the perfect tool to create an inventory, so Mason County contracted with Mid-West GIS to use GIS & GPS technology to create their inventory.

How Did Mid-West GIS Start With Traffic Sign Inventories?

The inventory took several months to create. Each sign was collected with sub-meter GPS data collectors. The location didn’t need to be any more accurate than sub-meter as the signs are easy to locate in the field. Aerial photography was also used to correct the placement of the points, as many are visible on the aerial photos. In addition, about a dozen different attributes were collected that pertained to the sign and the support structure.

Once the data was completed and put through Quality Control, it was delivered to the client. ArcMap was the editing tool to be used, so Mid-West GIS assisted with the installation of the software and data, as well as in depth training to teach Mason County staff how to update and maintain the data. The data was quickly used to identify signs that had poor or bad sheeting material or panel conditions, or signs that had Engineering Grade sheeting material. These were the first signs that needed to be replaced. By identifying these signs the county was able to get an accurate county on the type of signs to be replaced, as well as their location. This information was submitted as part of the grant, which was approved by the Illinois Department of Transportation. Once approved the county was on schedule to receive over $270,000 in assistance in replacing these outdate or damaged signs. The project was a huge success!

Over the next thirteen years Mid-West GIS has gone on to complete well over 500 additional Traffic Sign Inventories in states all across the country. So many clients see the need to have the inventory, the power behind having this data, and the need to outsource it to a contractor because of the labor intensive part of the data collection. We have had clients with as few as a few hundred signs, and some with more that 20,000+ signs. No project is too small or too big for Mid-West GIS to undertake. They are all equally important and equally necessary.

For more information please visit our Traffic Sign Inventory Page at\
https://www.mid-westgis.com/services/sign-inventory/

For a hassle free estimate please visit our Request a Quote page at
https://www.mid-westgis.com/quote/

To view our video on Traffic Sign Inventory Collection visit our Instructional Videos page at
https://www.mid-westgis.com/informative-videos/

Traffic Sign Inventory

Traffic Sign Inventory

Mid-West GIS has completed a comprehensive Traffic Sign Inventory for the town of Herndon, Virginia. The project was completed approximately ahead of schedule. The data was collected using GPS Data collectors and ESRI ArcMap technology. GPS locations, digital photos and approximately 20 attributions were collected for each individual sign on all roads maintained by the town of Herndon. High resolution digital photography, street centerline data, and town boundaries were also used as a part of this project.

For more information on traffic sign inventory projects please click here or contact us today!

Why Use the Sign Life Maintenance Instead of a Reflectometer

Why Use the Sign Life Maintenance Instead of a Reflectometer For almost 13 years now Mid-West GIS has been creating Traffic Sign Inventories for cities and counties all over the country. In these years we have been asked countless times about the use of a reflectometer, and if we recommend using that maintenance method. To be honest, in thirteen years we have not had one client that even owned one. The cost of the reflectometer itself can run $12,000-$15,000 and many of our clients simply cannot justify or afford this piece of equipment. The other aspect of the cost of this way of maintenance is the labor. Using a reflectometer is labor intensive. It requires multiple readings on each sign and those readings have to be documented in the database in order to be useful for identifying signs that’s fail. Once again, the cost just doesn’t work when there are other more cost effective alternatives.

One of those cost effective alternatives, and the one Mid-West GIS recommends using is the sign life program. This allows the client to use the manufactured date and the manufacturer’s warranty to calculate when the sign should be replaced. For example, a stop sign is manufactured in 2019 and installed in December of 2019. This sign has a 10 year warranty. Therefore we know that this sign should be replaced in 2029. How we handle that in the Traffic Sign Inventory is to add four fields in the database. They are: Manufactured Date, Install Date, Warranty Years, Replacement Date. It is very simple to populate these four fields when a new sign is placed in the field, it only takes a minute or so and is incorporated into the work order to replace or add a new sign.

We understand when we create a new Traffic Sign Inventory the existing signs do not have this information for the most part. So Mid-West GIS uses a Sign Condition Rating to document the existing sign condition rated by Good, Fair, Poor, Bad. Signs with a bad rating need replaced immediately, poor need to be replaced in the next 1-3 years, fair need replaced in the next 4-6 years, and good signs still have 7+ years of life remaining. We setup the database so the client can populate the four new fields as these signs are replaced, and this is done for every new sign. This process gives the client an up to date and accurate Traffic Sign Inventory, as well as moving them into the new Sign Life maintenance program.

The Town of Herndon, Virginia Awards Sign Inventory Project to Mid-West GIS

The Town of Herndon, Virginia has contracted with Mid-West GIS to create a GIS & GPS based Traffic Sign Inventory. This will be a complete inventory of all traffic signs on Town maintained roads. Herndon is a suburb of Washington, D.C. with an enormous amount of traffic, this project will take several months to complete. The Sign Inventory project is scheduled to start in October 2019 and be completed by the end of December 2019.

The Town of Herndon, Virginia Awards Sign Inventory Project to Mid-West GIS

How do I use a Traffic Sign Inventory?
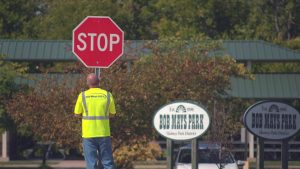
How do I use a Traffic Sign Inventory?

How do I use a Traffic Sign Inventory?

As the owner of Mid-West GIS, as well as being in the field for over 20 years, I commonly am asked by both existing and future clients how they can and should being using our Traffic Sign Inventory GIS database. This is a very valid question, as there are many uses and functions to the data, and in order to get the most return on your investment you need to be utilizing it to its full capabilities. So I decided to share some of my questions and answers with the GIS and Traffic Sign community so that more users can take advantage of their Traffic Sign Inventory GIS data.


Question: Is the data hard to maintain?

Answer: The majority of the cost and labor is in the initial collection of the data itself. Once the data is in place, updating and maintaining the data should be very easy and really doesn’t take much time at all. Let’s take a few examples. The first would be where you have an existing sign that is already in the Traffic Sign Inventory, but has been changed out with a new sign in the field so the Traffic Sign Inventory needs to be updated. You can locate the sign one of two way; you can do a query on the database using a field such as a Sign ID, or you can simply zoom to the location of the sign in the map application if you know exactly which sign you are updating. Once you locate the sign, you select it so you can edit the database attributes. Since the sign already existed in the Traffic Sign Inventory the database attributes area already filled out with the old information. Most of this information will stay the same because you are most likely replacing with the same type of sign, for example swapping out an old stop sign with a new stop sign. Therefore, the only attributes you would need to update would be ones like Sheeting Material Type, Sign Condition, Install Date, and maybe a few others. Once you are done you save your edits and you are finished. In the second example you would be adding a new sign into the Traffic Sign Inventory that did not already exist. Let’s say you are adding a new Speed Limit 35 sign. In this instance you can also use two methods. The first is you once again zoom into the location on the map, and can add a sign point using the editing tools. Once you add the point in the correct location you would need to populate the database attributes, because they would all be blank at this point. It only takes a few minutes to go through the entire list of fields and update the information. This is similar to the process done in the field by our GIS Technicians when the initial collection is done. Once all fields are populated, and I also recommend going back over them quickly to verify the information is correct, you save your edits and are done. The other method to adding data is by using a GPS data collector in the field. This method is a little more technical but not bad if you are familiar with the GPS equipment. You would take the GPS data collector into the field, collect the point at the location the new sign has been installed, and then populate the database attributes after the point was stored. Once you are back in the office the GPS data would need to be imported back into the Traffic Sign Inventory. So, as you can see there are a few ways to both update, and maintain the data. I always recommend finding the one you are more comfortable with, and create a document that walks you through the work flow until you are familiar with all of the steps.


Question: How accurate does the GPS point need to be for a Traffic Sign Inventory?

Answer: This is a question we are asked quite often. With so many options on accuracy, it can be very confusing. It can also affect the cost of the data collection, as it is more expensive and time consuming the more accurate the GPS data is being collected. My recommendation is to go with a sub-meter accurate GPS point. The reasoning behind it is mainly because you are dealing with a feature (traffic sign) that is very visible and easy to locate in the field. You don’t have to go searching around for it once you are at the correct location where the sign is supposed to be. So, it doesn’t need to be sub-centimeter accurate like a feature such as a water valve would be. On the other had you don’t want to go with a point that is less accurate, otherwise when you are collecting a point it may end up in the middle of the street because the GPS data isn’t accurate enough. After 12 years of collecting Traffic Sign Inventories we have narrowed it down to sub-meter accuracy. Now week in mind once the GPS data has been imported into the map application, we always do a quality control check on the location using the street centerline data and the aerial photos to ensure it is in the right place. Sometimes it is off a little and we will adjust it as needed, like it may show on the sidewalk and you know its between the sidewalk and the curb, so we will move it over between the two.


Question: How do I get a list of certain types of signs for maintenance purposes?

Answer: This is the power of the GIS database, being able to query or ask a question to the database, and receive results back that you can use to make decisions. In ArcMap there is a query tool. When using this tool on the Traffic Sign Inventory data layer you can make a simple or complex query. Let’s say you wanted to get a list of Stop signs that are poor condition. When you are making the query, it lists all of the attributes out in the query builder. So, you would select “Sign type = STOP” and “Sign Condition = POOR”. It is as simple as that. When you run the query, you can open the database and all of your stop signs that are rated as poor condition should be selected. You can now print a map showing the location of the signs, as well as print the database to go with it. This is a great tool for budget planning. You can run multiple queries on the types of signs you want to replace in the upcoming budget year, then using these reports you can accurately obtain counts on how many of each sign needs to be replaced. Then you use these numbers to calculate the cost to replace each sign. Gives you the ability to present accurate numbers on what type, how many, and at what cost to the decision makers working on your budget.


Question: My computer crashed and we lost our data, how can I get it back.

Answer: Backup, Backup, Backup. Always back up your data to another source. Too much time, effort, and money are put into the creation and maintenance of this type of data to take chances losing it. I always tell my clients to keep a backup of the data off-site. Now that there is an amazing amount of cloud storage for a reasonable cost this is the route I recommend. Most Traffic Sign Inventories are not to large to use this storage option. On average I would say they are between 30 and 50 megabytes. Now that does not include digital photos if you have that as an attribute. Those can be quite large. So, in the end, find an external backup option that works best for you and make sure you utilize it on a regular basis. I try to make nightly backups of critical data, and weekly backups of the rest. Seems like overkill, until you lose a hard drive and need that data back.


These are a few of the more common questions. I plan on doing a second installment of this article soon and sharing others that we receive as well. It is always good to share knowledge with each other. We learn from each other’s successes as well as our failures.
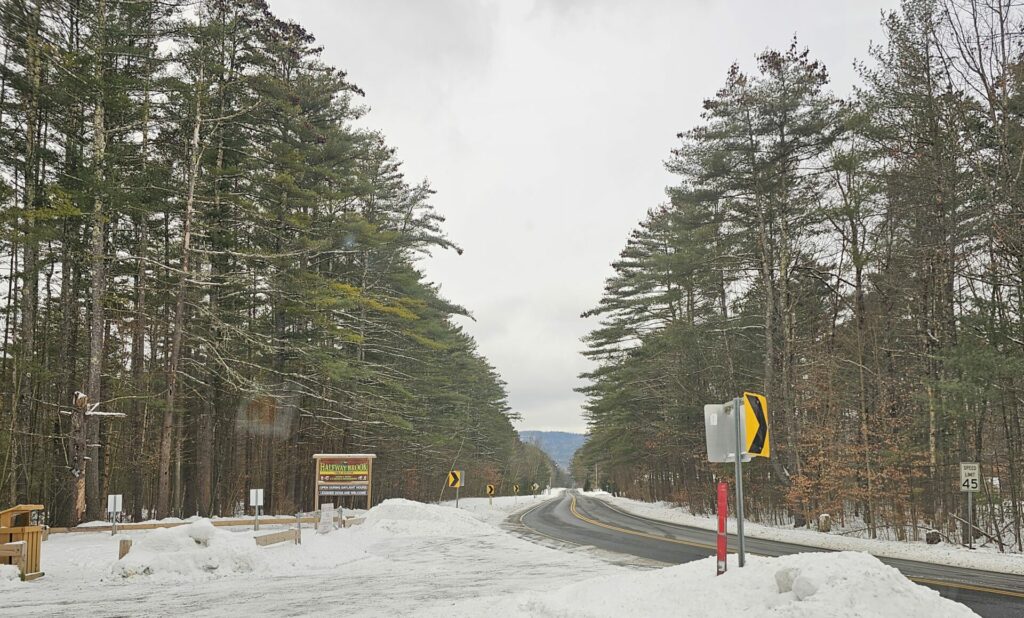
Case Study for GPS Data Collection for South Windsor, Connecticut Traffic Sign Inventory

In the Spring of 2016, the Town of South Windsor, Connecticut contracted with Mid-West GIS to create a comprehensive Traffic Sign Inventory. While the town used GIS technology, they had no existing sign database, and they realized that the effort to create one in-house would take years, as well as resources they did not have available.

South Windsor is located in Central Connecticut, just north of the City of Hartford. It has a population of over 25,000 and was incorporated in 1845. The town has approximately 192 miles of road, and the project encompassed collecting all signs on roads the town maintains.
Data collection was done using a combination of handheld GPS data collectors, as well as mobile GIS technology using tablet PC’s with GPS capabilities for navigation and attribute collection. The handheld GPS was used to collect the GPS point and assign a unique identifier, and the tablet PC was used to collect the attributes for the sign and post, as well as collecting and hyperlinking a digital photo of the face of the sign to the GPS point. Tablets are used for the attribute portion as they are easier to type multiple attributes quickly, and have the digital photo capability.
The project had a very tight schedule, as the town was anxious to receive the data and put it into use as their official Traffic Sign Inventory. Data collection took under a month, including Quality Control and delivery. Over 4,200 GPS points were collected, as well as one photo for each sign. The project was delivered on time and on budget, and the client proved to be very happy with the final product.

I wanted to take a minute to thank you for your services in the collection of our street sign inventory. I was skeptical that you could meet the timeframe that you set to collect all our signs town-wide. But to my dismay, you were right on target. Your aggressiveness in getting the work (collection) done but with the attention to detail made for a great finished product. I have yet to find a report that I cannot produce to get the answers I am looking for. Our police department uses the program for incident investigations as well as determining locations where signs, such as speed limits, were never installed are warranted.

We couldn’t have developed a program such as the one you delivered using our in-house staff, we tried. It was too time-consuming.

Again, we thank you for your willingness to work with us, customize what we wanted, collect, analyze and test the data which allowed us to get to work the day we received the finished product. I am so glad we made this decision!!!

Scott Yeomans
Associate Manager
South Windsor Public Works
Street Services

Case Study for the City of Carrollton, Texas

Mid-West GIS was contracted by the City of Carrollton, Texas to create a comprehensive traffic sign inventory using GPS data collectors, and migrated into an ESRI personal geodatabase model. The project began in March of 2018 and was successfully completed by July 2018. The project entailed collecting over 1,200 miles of road in a city with a population of over 135,000 residents. Carrollton is located in the Dallas Metroplex in the great State of Texas.

It took Mid-West GIS approximately five months to Collect, Quality Control, and deliver the data to the city. There were over 20,000 signs collected, and over 20 different attributes documented. In addition, one digital photo was taken of the face of certain types of signs and hyperlinked to the GPS point.

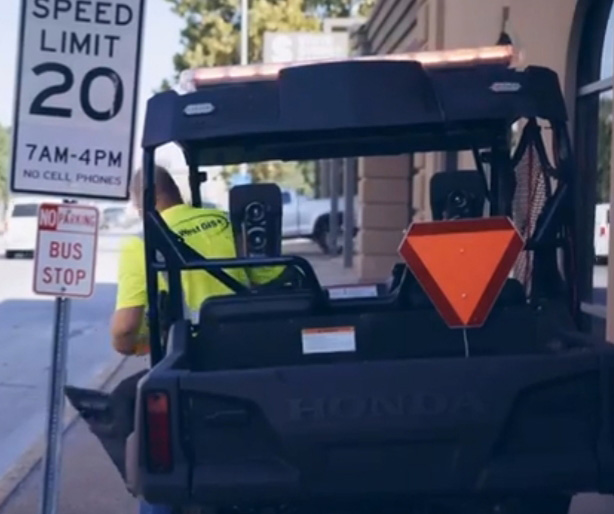
With high traffic volumes the city posed the challenge of being able to safely and accurately collect signs on major arterial roads such as Beltline Rd running east and west. The city allowed the use of a side by side all-terrain vehicle equipped with slow moving vehicle signs, and amber safety light that allowed us to maneuver down the right away without slowing or interfering with traffic. This was much safer, and did not require blocking traffic at all. This will be incorporated into future projects that pose the same type of traffic challenges.

The project was delivered ahead of schedule, and the client was completely satisfied with the data that was collected. The data is now being used as the official sign inventory for the city, and used daily by GIS staff and sign maintenance personnel.

How Does Mid-West GIS Collect Traffic Sign Inventories?

Mid-West GIS has been collecting Traffic Sign Inventories since 2007. With over 500 clients nationwide, we have become one of the few companies in the United States to collect traffic sign data using GIS & GPS technology. This method of collection, and ensuing maintenance program meets and exceeds the mandates set forth by the Federal Highway Safety Administration.

How Does Mid-West GIS Collect Traffic Sign Inventories?

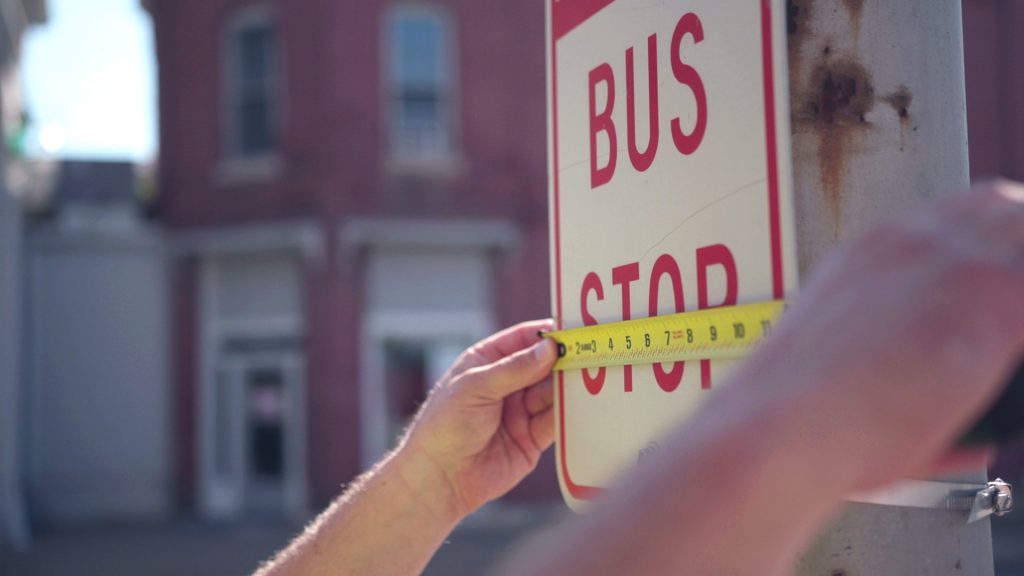
The process of collecting traffic sign data by Mid-West GIS involves the use of GPS data collectors. The Technician will approach the sign on foot, and using the GPS unit will collect a highly accurate GPS point at the base of the sign. This gives the positional location of the sign itself. This process doesn’t take long, as the GPS unit just needs to log the coordinates. Once the coordinates are stored then the Technician will proceed with collection of the attributes of the sign and support structure. Some companies have taken the approach of collection of the location of the sign using a moving vehicle.  Mid-West GIS, as well as many other officials, have frowned on this type of data collection because the accuracy of the point is not good enough to pass our standards. Mid-West GIS Technicians actually collect each and every sign standing directly in front of it with a GPS unit.

Street Sign Inventory Attributes

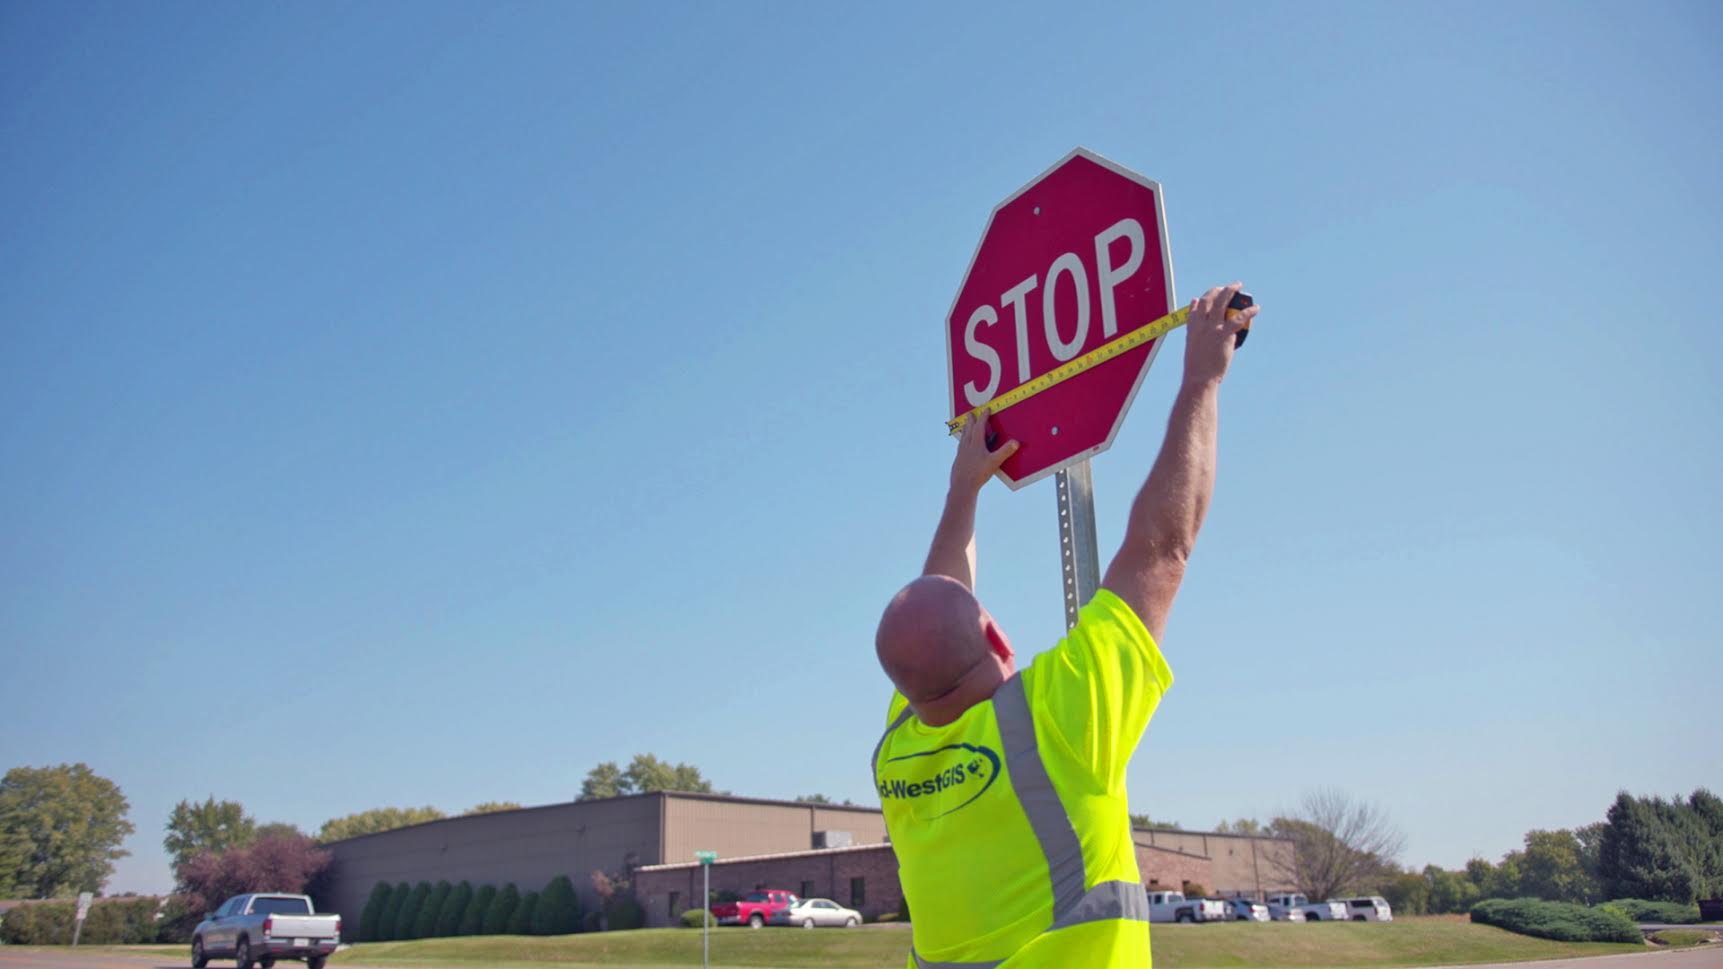
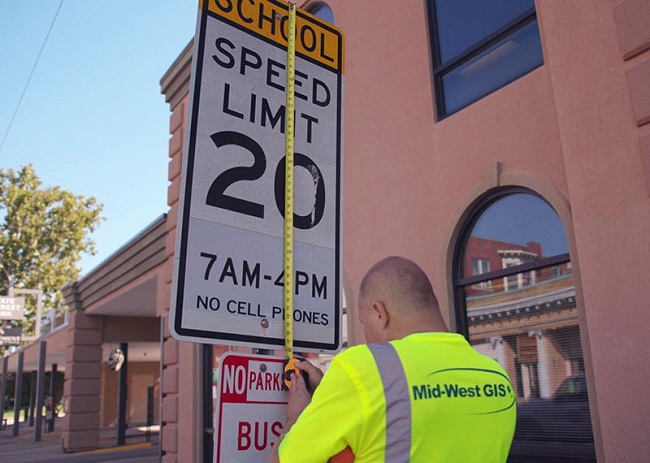
The attributes that are collected vary from client to client, but we encourage our clients to collect as much data as possible associated with the sign and the support structure. Some of the more common attributes collected are: Sign Type (Stop, Yield, Speed Limit 30, etc.), Sign Size (18”x24”), Sheeting Material Type (DG3, HIP, etc.), Sign Condition (Good, Fair, Poor), Sign Color (Red & White, Green, etc.), Panel Material (Metal, PVC, Wood, etc.), Post Type (Wood, Square Steel, U Channel, etc.), Post Condition (Good, Fair, Poor), Direction Facing (North, South, East, West, Northeast, Southeast, Northwest, Southwest), Digital Photo (1234.JPG), and Date Collected. Other attributes can be collected as well. Some clients have stickers with install dates, manufacture dates, or sign numbers that can be documented as well. Again, the more attributes that can be collected during the initial collection phase the better.

Once the data has been collected the Technician will go over the attributes quickly to make sure all fields have been populated, then move on to the next sign. If there is another sign on the same post then the signs will be collected from the bottom sign to the top sign. This can be done one of two ways. The first and most popular is to add a new GPS point in the same location, then populate the attributes for the new point. If you have two signs on one post you would have two points in the same location. The other option is to have a longer attribute table and add the 2nd sign right after the first, so you have one point, with many more attributes. The first option makes database searches a lot easier, as you are searching one field in all of the points.

Quality Control

Once all of the signs have been collected for a client the data is put through two levels of Quality Control. The first is a visual inspection of the location of the signs. This is basically to make sure the signs line up on the aerial photography like they should. If a client has high resolution aerial photography a lot of times you can see the shadow of the post on the photo, and the GPS point should line up right at the base of the shadow. This ensures the positional accuracy of the point. The next phase is to do Quality Control on the database. This will go through every sign and every attribute and make sure all fields were properly collection and populated. It will identify and correct any typos during collection. Overall make sure the attribute data is complete and correct. Once the Quality Control is completed the data is ready for delivery to the client.